
Day traders often
employ an impulsive, gunslinger type style of trading which is often more
emotionally based than anything else. This attitude often to leads to a series
of frustrating, demoralizing losses and eventually leads to the demise of the
average day trader.
Our objective here is
to demonstrate a scientific, technically based, methodical approach to day
trading which will lead to a successful experience in the day trade arena.
I will demonstrate two
separate approaches which traders can utilize to achieve the goal of 80% day
trading success. The first will detail the use of a series of proprietary,
computerized indicators, which, when combined with logical discretion by the
trader, has been shown to achieve positive results in the 80% plus area.
Discretionary,
Indicator Based Day Trading
This approach to
logical day trading involves a four step application of several market filters
to properly position, enter and exit a profitable trade.
In the written
description below and in the actual conference presentation I will describe the
following four points which will lead the trader to a day trading method with an
80% success rate.
The four steps are:
1.
Determine the major
trend of the day.
2.
Determine the minor
trend of the day within the major trend.
3.
Define an exact entry
point for a trade.
4.
Define an exact exit
point for a trade.
1.
Determine the major, or dominant, trend for the day.
Intraday trends can be
classified into three basic categories. The market will either be in an uptrend,
be in a downtrend, or will not demonstrate a dominant trend for the day, in
which case the trend is said to be sideways, or indeterminate.
Why is this important?
Simple. If we can determine that the major trend of the day is, for example, an
uptrend, we will only take day trades which are in the direction of the major
trend, or higher. Thus, on these days, only buy side trades will be entered. All
signals indicating short trades will either be ignored or used to exit the long
trade currently in progress. This is a very powerful consideration in any day
trading scenario. In this manner one is able to concentrate only on those day
trades which are more likely to be successful since they are taken in the
direction of the major trend of the day. Remember, “The Trend is your
Friend”. Traders can drown swimming upstream.
Often,
it is just as important the know when not to trade as to know when to
trade. Filtering out many of the losers early in the day will
drastically raise the percentage of winners at the end of the day.
Close observation of
intraday price activity will reveal that, in many instances, the high or low of
the entire trading day will be established within the first part of the day. For
instance, the high or low of the S&P 500 index futures market will often be
established during the first hour of trading. This same phenomenon is also
observed on price charts of the actual stock issues which make up the various
market indices.
I have developed two
trading tools which can, with 80% accuracy, determine that either the high or
low of the day has been established within the first hour of the day.
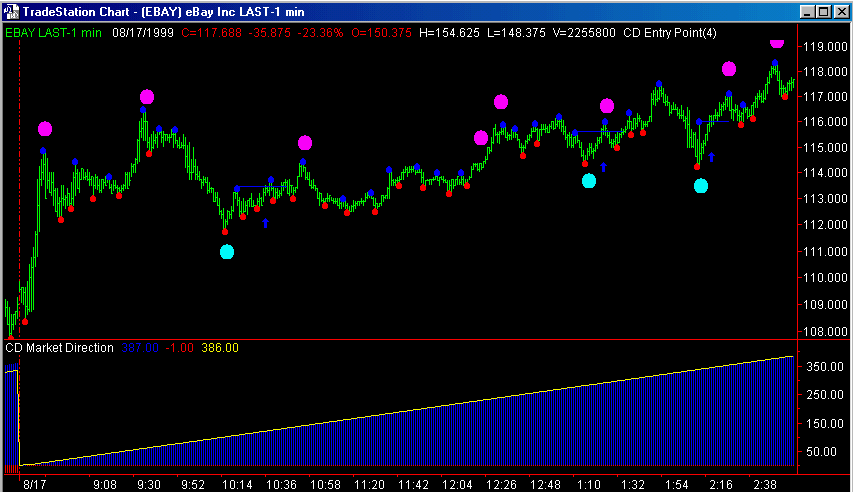
One of these indicators, the CD Market Direction Indicator, is shown on the chart below.
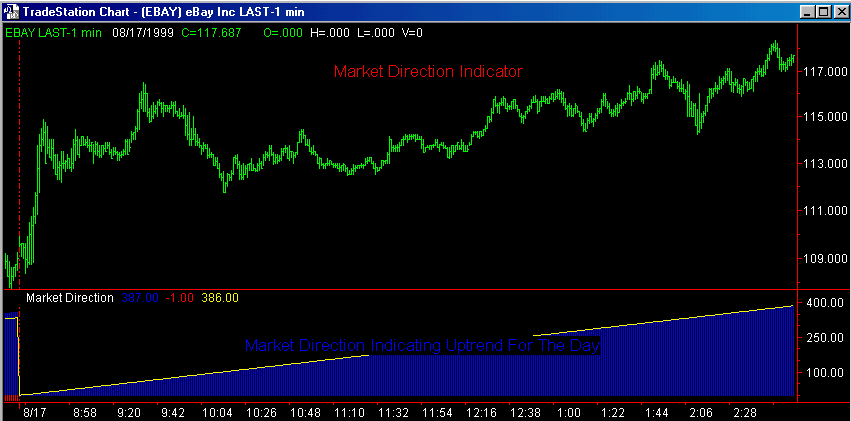
On this one minute
chart of EBay from August 17, 1999, the CD Market Direction Indicator is
illustrated by the histogram at the bottom of the price chart. The steadily
rising profile of this indicator on the chart is indicative of a market in which
the low of the day has been established early in the trading day and, therefore,
if there is to be range expansion for the remainder of the day, the probability
is very high that this expansion will be on the upside
of the market. This major trend determination can be made one hour into the
market day.
With this parameter adequately defined early in the day, we are able to concentrate only on the buy side of the market as the day progresses, ignoring the trades which may be indicated on the short side of the market. In this fashion we are able to filter out many of the trades for this day which would have been taken in the opposite direction of the trend of the day. Remember the old trading axiom, “The Trend is your Friend”. Trading in the direction of the major trend of the day is far more likely to produce consistent profits than trying to battle the major market forces by trading against the main energy flow of the market.
CD Market Direction: MORE CHARTS
2.
Determine the short term trend of the market.
Within the major trend
of the day multiple shorter term trends will develop as the market day evolves.
The ability to define these minor trends as they appear is essential to our
timing of a reasonable entry into the market in the direction of the major trend
of the day.
During a major
uptrending day there are multiple short term corrections within the progress of
the climbing market. Definition of these minor trends and the determination of
the extent of these minor corrections is essential to the timing of our entry
into the market.
These minor trends can
be defined by measuring exhaustion of the minor moves. No market move will
continue in the same direction forever. There are frequently pullbacks
throughout the move which can be used to enter the market in the direction of
the major trend. A minor move is about to come to an end when the energy of the
market begins to dissipate. When the energy of the market is nearly used up, the
market is experiencing exhaustion.
Exhaustion is a complex
market characteristic which may be exhibited in multiple formats.
I have programmed four
separate indicators, CD Reversal, CD Cluster, CD Real Time Pivot and CD
Exhaustion, to identify these minor corrections of the major market move, each
measuring exhaustion in its own mathematical manner.
Although each trading
tool is capable of the identification of exhaustion of its own accord, the
appearance of more than one indication of this phenomenon at the same time on a
price chart significantly enhances the possibility of the success of our trade.
In other words, the probability of a trading signal being a profitable one is
significantly greater when two of our tools are indicating exhaustion at the
same point on the chart. Since they are both looking for the same
characteristic, price exhaustion, but are doing so in distinctly separate
mathematical approaches, the chances of an accurate entry are much greater when
two of these programs gives a signal at the same time. Obviously, if three
indicators are plotting alerts on the chart at the same time, the chances of a
profitable entry are increased accordingly. Adding a fourth determination of
exhaustion at the same point on the chart, while not guaranteeing a profitable
trade, certainly again increases the possibility of a reasonable entry.
One of these short term
direction indicators, CD Reversal, is detailed on the chart below.
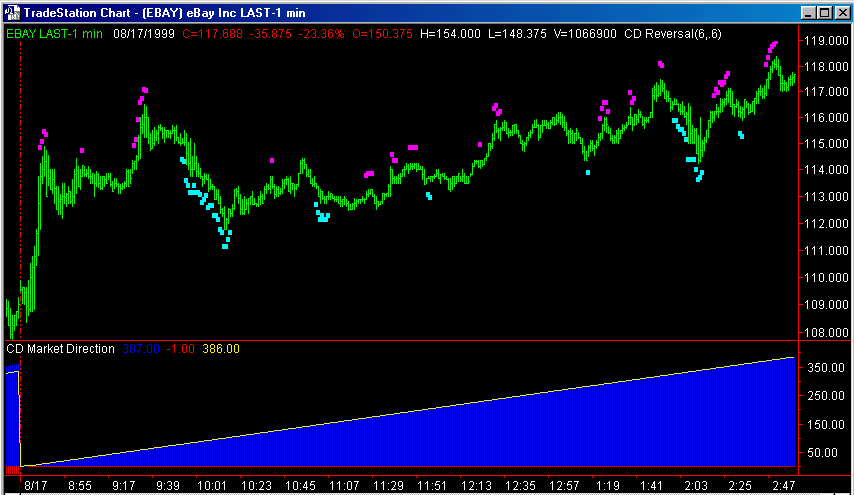
The CD Reversal indicator is shown on the chart as small cyan squares which appear below the price bars. The first appearance of these markers is significant in that it will identify a downtrend which is beginning to exhibit signs of impending exhaustion. When the small squares cease to plot, the exhaustion phase is complete and a price reversal to the upside should be expected to begin. Note on the price chart above multiple examples of such a trend change when the indicator stops plotting. It is important to note that the number of small squares plotted is not significant for the purposes of analyzing the market trends using this indicator. What is significant is first, the appearance of the plots, signifying impending exhaustion, and then the absence of the plots in question, confirming the completion of the exhaustion phase.
Another of our short
term determination indicators, CD Cluster, is added to our chart on the image
below.
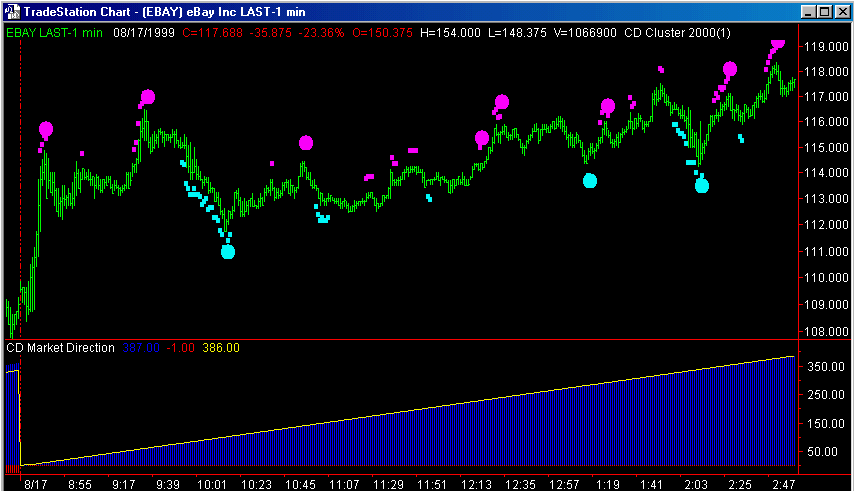
In the example above,
the cluster indicator is displayed as a larger cyan dot
below the price bars. As the CD Cluster indicator determines the presence of
market exhaustion in a totally separate manner than the CD Reversal indicator
demonstrated earlier, the appearance of both of these indicators at the same
time gives the trader a higher percentage that a price reversal is imminent.
Note on the chart above the instances in which the CD Reversal and CD Cluster indicators both measure exhaustion on the same price bar. Note the price reaction to the upside when these points occur.
Note the large magenta
dots also placed by the CD Cluster Indicator. These are sell
signals as calculated by this tool. Recall, on a day such as this one
where the trend for the day has been determined to be higher,
that we will take only the buy signals from
our indicator group. In this case these signals will be ignored for entry
purposes. An alternative use for these large magenta
dots is to use them for an exit tool on an up day.
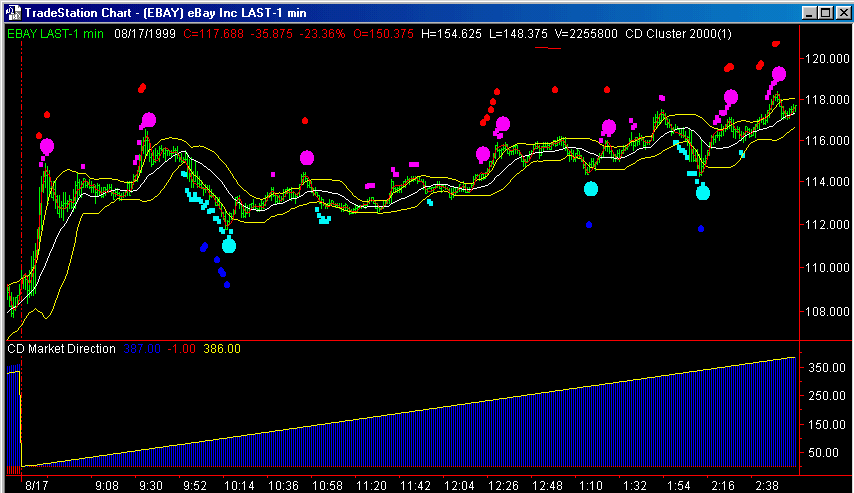
Two other short term indicators, CD Exhaustion and CD Real Time Pivot, also calculate points of short term exhaustion. The CD Exhaustion Indicator is plotted on the chart above as two yellow lines, one red line and one white line, while the CD Real Time Pivot is displayed as a blue dot below the bars and a red dot above the bars.
CD Exhaustion gives sell signals when red line rises above the upper yellow line and then turns lower.
Sell signals are generated by the CD Real Time Pivot when a small red dot appears above the bars.
Clearly, superior buy signals are generated when all four programs are calculating exhaustion at identical points on the chart.
CD Exhaustion: MORE CHARTS CD Real Time Pivot: MORE CHARTS
3.
Determine
the Entry Point
Even though we have now
determined that the major trend for the day is higher and we have reached a
point of exhaustion for the corrective downside move, there is one more
determination that is necessary at this time to establish an adequate trade
entry. We must now identify an exact price point that, when violated by market
activity, will confirm the change in direction of the market.
To determine this exact point on the chart we will use the CD Entry Point Indicator.
This trading tool
operates by defining very short term support and resistance on the price chart.
In the instance of our long trade, we will use the indicator to define overhead
resistance on our chart.
Resistance is defined
by this tool as price level at which, over the short term, the market has had
difficulty penetrating. At these levels, sellers have overwhelmed the buyers in
the market and the price has retreated from this point.
Since these levels have
been difficult for the market to penetrate in the immediate past on the chart, a
successful move through this point is indeed significant. In this fashion the
market confirms the expected change in trend by moving through a price level
that it was unable to penetrate just a few minutes ago.
To adequately utilize the identified resistance on the price chart, we will place a buy stop slightly above the defined resistance after we have successfully determined the existence of an uptrend for the day and the presence of an exhausted corrective move. When the market trades through the overhead resistance as identified by the CD Entry Point Indicator we will have then entered the market in the direction of the major trend of the day, expecting that the trend will continue higher and conclude a successful long trade.
4.
Determine
an Exit Point
Now that we are in a
long trade, we must identify a strategy which will produce a profitable
conclusion to our current trade.
As mentioned earlier in
this discussion, indications of a short trade can be used for the purpose of
exiting a long trade on an up day. Sell signals issued by the same indicators
which got us into the market can be used to provide exit points for our trade.
Our CD Real Time Target (CD RTT) Indicator is also an excellent tool to set a target level for the exit of our long trade. This trading tool uses a proprietary formula to calculate a target level using prior market activity. As is the case with all of our trading tools, self adaptive parallel functions are used extensively in these determinations. Our research has shown this tool to be accurate in excess of 80% of the time across all markets. In addition, we have two trailing stop indicators, CD Volatility Stop and CD Cluster Volatility Stop, which can be used to place trailing stops behind the market.
By using the above four steps to day trading success you can:
1. Determine
the major trend of the day using the CD Market Direction Indicator. This tool is
80% accurate in this determination when viewed one hour after the market
opening.
2. Determine the minor trend of the day using the CD Reversal, CD Cluster, CD Real Time Pivot and CD Exhaustion Indicators.
3. Determine an exact entry point using the CD Entry Point Indicator which defines short term support and resistance.
4. Determine an exact exit point using the CD Real Time Target Indicator. This tool has been in excess of 80% accurate when tested across all markets.
Part
Two
Automated
Day Trading
The second portion of
my presentation will concentrate on the use of an automated day trading strategy
which will automatically issue buying and selling price levels shortly after the
opening of the market each day.
This automated day
trading system is programmed in the popular Omega Trade Station 2000i platform.
The system also makes extensive use of parallel function technology, a unique
system development technique which allows the system to continually adjust its
routines to current market conditions. More information on this technology is
available at clayburg.com.
This version of the
SPECTRUM System concentrates upon the relationships which develop between the
relative positions of the high, low and close over several days to determine the
extent of follow-through tendencies which exist in the market in question. This
follow-through factor is then used to place a buy stop above or a sell stop
below the opening of the market for the next day’s trade. The program then
takes positions as the market moves through the buy stop thereby taking
advantage of range expansion in the direction of the follow-through tendency of
the market.
The program offers the
user the option to exit the trade either at a predetermined profit level or at a
target level as determined by the Real Time Target Indicator discussed above.
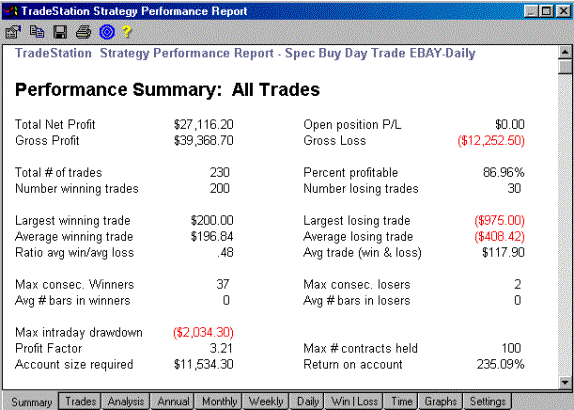
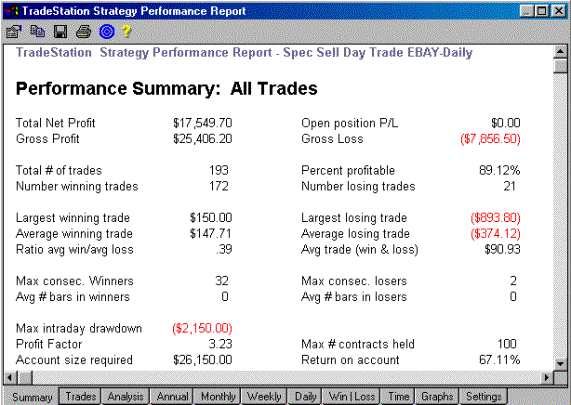
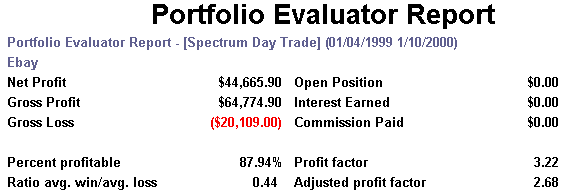
Printed below are
system results from the system testing from Ebay, one of the more popular day
trading stocks.
Reports are presented
separately for the buy side and the sell side of the system. Finally you will
see a report which combines both the buy and sell sides of the system.
You will note that the
system was tested on daily data. While this type of testing was not considered
to be accurate on the former versions of Omega software, new capabilities in the
2000i series enable a system to look inside a daily bar for testing purposes.
Reports created in this fashion are an accurate representation of actual
trading.
The system reports are
based on the hypothetical trading of a 100 share portfolio of the stock in
question. Testing began on January 4, 1999 and reflects trades taken through
January 10, 2000. The assumption was also made that the account size required
was based on the purchase of 100 shares on January
4, 1999, with 100% of margin.
Note that the percent profitable category is in excess of 80% on all reports.
The following data
represent the results of hypothetical system testing. Please be aware of the
following prior to proceeding.
Hypothetical
performance results have many inherent limitations, one of which is that any
account will or is likely to achieve profits or losses similar to those shown.
In fact, there are frequently sharp differences between hypothetical performance
results and the actual results subsequently achieved by any particular trading
program. One of the limitations of hypothetical performance results is that they
are generally prepared with the benefit of hindsight. In addition, hypothetical
trading does not involve financial risk, and no hypothetical trading record can
completely account for the impact of financial risk in actual trading. For
example, the ability to withstand losses or to adhere to a particular trading
program in spite of trading losses are material points which can also adversely
affect actual trading results. There are numerous other factors related to the
markets in general or to implementation of any specific trading program which
cannot be fully accounted for in the preparation of hypothetical performance
results and all of which can adversely affect actual trading results.
The first two reports
detail testing results on first the buy side of the system and then the sell
side.
The following report is from the first few lines of the Portfolio Evaluator Report detailing the hypothetical testing results when both the buy side and the sell side are combined.
A detailed, 14 hour video tape presentation discussing the application
and use of all systems indicators and methods discussed in this presentation is
available from Full Spectrum Trader, Inc.
All software used to produce the results detailed in this presentation
is also available in the Omega TradeStation / SuperCharts format.
Complete information can be found on our web sites:
Click below for more than 160 charts from the video
Full Spectrum Trader Chart Support