|
|
|
|

Support Resource Center
Chart 25
JFC Exhaustion Indicator
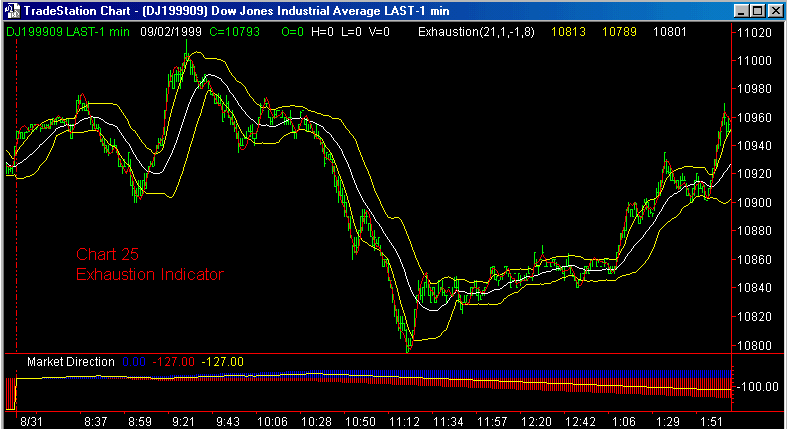
Chart 25
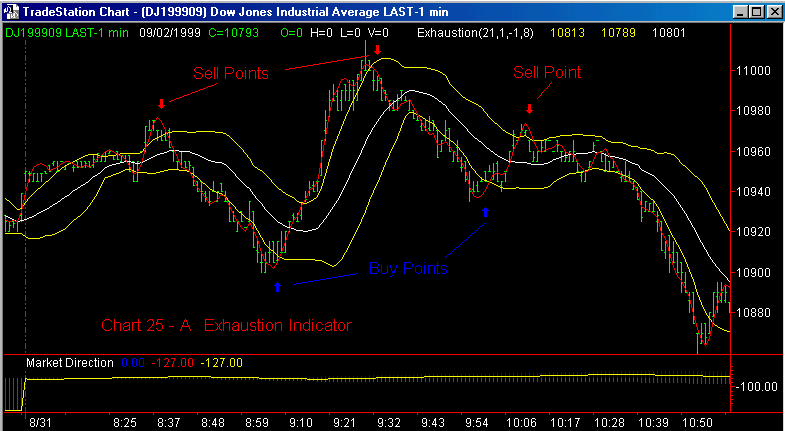
Chart 25 - A
|
|
|
|
Support Resource Center
Chart 25
JFC Exhaustion Indicator
Chart 25
Chart 25 - A
Chart 25 - A expands the first 2.5 hours of Chart 25 to provide better detail on the plots of the JFC Exhaustion Indicator and how they can be used to generate buy and sell signals.
Recall from the video presentation that buy and sell signals are generated when the red, faster moving line leaves the confines of the two yellow bands and then turns back toward the yellow lines on a closing basis.
As always, the interaction of the various tools in your indicator
package is of vital importance. With that in mind, please refer to the
section on the JFC
Entry Point Indicator
for a detailed explanation of the use of the JFC
Cluster and JFC
Market Direction
Indicators to generate actual trading signals. This same chart from August
31, 1999 Dow Jones Futures has been used for both examples.
More Details: JFC
Market Direction JFC
Cluster JFC
Entry Point