|
|
|
|
|
|
|
|
JFC Cluster
Volatility Stop Indicator
The
JFC Cluster Volatility Stop Indicator is a combination of the features of the JFC
Cluster Indicator and an adaptation of the JFC Volatility Stop Indicator.
This
indicator can be used to define both an entry point and a trailing stop which
can be used for an exit routine.
The
entry routine is the exact same sequence which is used to calculate the JFC
Cluster Indicator. The large Magenta and Cyan dots which are plotted by this
indicator are exact duplicates of the signal dots placed by the JFC Cluster
Indicator.
The
trailing stop begins plotting as soon as the JFC Cluster portion of this trading
tool has indicated a buy or selling opportunity. By closely observing the
placement of the plots which follow, the trader is able to place a protective
trailing stop behind the position, thereby progressively either reducing the
risk being assumed by the trade or locking in sequentially higher profit levels.
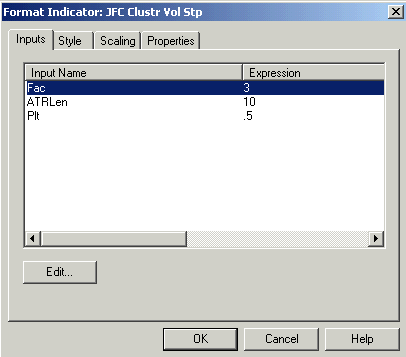
There
are three inputs for this indicator as identified in the image on the prior
page. The first two inputs, Fac and ATRLen,
regulate the relative rate at which the trailing stop feature of this indicator
“closes in” on the price bars.
The
Fac input will accept decimal inputs. Users are encouraged to experiment with a
range of decimal settings for this input in order to define an acceptable
trading strategy.
Only
integer, or whole number inputs may be used for the ATRLen input. Decimal
settings used here may produce unpredictable results.
Generally, the larger the
values for both of these inputs the slower will be the progression of the
trailing stop plot toward the price bars. Traders who take a longer term
approach to trading their market of choice will use these larger values.
The particular settings of 4
and 10 as demonstrated in the Setup
Screen image, are at the lower end of settings that could be used for longer
term time frames.
The
benefit of using the longer term approach is the increased likelihood of
maintaining a larger profit for each trade, thus taking advantage of the trading
axiom, “Let Your Profits Run”.
The
downside is that the stop, as a general rule, will be maintained at a greater
distance from the actual price bars and will move closer to the bars at a slower
rate, thus increasing the possible loss on the position should the stop be
activated by market action.
The
trade off here is much the same as with any trading scenario, the possibility of
increased profits which are gained by the longer term positions carries with it
the risk of a somewhat larger loss since the maintenance of the long term
position requires the use of a larger, more distant stop.
Such
a trading strategy, properly designed and implemented, would be expected to
produce a lower percentage of winning trades with a higher per trade profit.
This strategy is more applicable to a less volatile futures contract or stock
issue and one in which the trader is expecting a longer term, steady, trending
market move.
Conversely,
lower values for the inputs of the JFC Cluster Volatility Stop Indicator will
move the trailing stop plot toward the price bars at a more rapid rate.
The
advantage to a more rapidly moving volatility based trailing stop is that the
protective stop will move more quickly to reduce the risk being assumed by the
position and eventually lock in progressively higher profit levels as trading
progresses.
This
strategy is designed to more closely fit the attitude and trading style of the
more aggressive, scalping type trades being used today by short to ultra-short
term day traders operating in the volatile stock market index markets and very
active, high value internet stocks. Since these markets have the ability to
quickly move against the position of the trader it is often advantageous to have
a protective situation forming on your chart which will quickly reduce the risk
associated with the current position.
The obvious downside to this
shorter term trading strategy is the possibility that new positions can be
quickly exited if the market makes only a slight corrective move against your
position.
These short term corrections
against the dominant trend can be brief, but abrupt and violent enough to stop
out a position if the trailing or protective stop is too close to the market.
The key to successful trading
utilizing this shorter term trailing stop strategy lies in the formulation of an
input combination for the JFC Cluster Volatility Stop Indicator. In other words,
placing a stop, which will produce the desired protective strategy without
resulting in an excessive rate of stop outs which result from minor corrections
in the market.
As this setup will vary
markedly both with the market and the individual trading strategy of the user,
considerable research will be necessary. The trader will find it necessary to
examine considerable historical data, adjusting the inputs for the indicator
until an acceptable setting is found.
The
last input, Plt, as with the JFC Cluster Indicator, regulates the distance from
which the large Magenta and Cyan dots are placed from the price bars.
It
is important to note here that the Plt input has no bearing whatsoever on the
placement of the trailing stop portion of this indicator. The placement of this
feature is totally directed by the values entered by the user for the first two
inputs on the screen below.
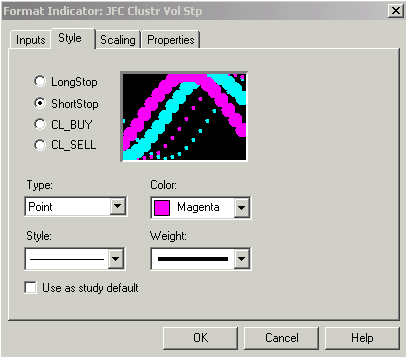
There are four separate plots
active for this indicator, as noted above.
The CL Buy and CL Sell plots
are identical to the JFC Cluster Indicator.
The
LongStop and ShortStop color selections will set the color for the trailing
stops which form after the placement of the Buy and Sell plots appear. The
colors for these plots is defaulted to the same color as the large Buy and Sell
dots, or Cyan and Magenta. By using the style settings as shown on the prior
page, the user has the ability to set the trailing stop plots to colors other
than the color of the Buy and Sell dots if a different color combination
enhances one’s ability to interpret these two plots.
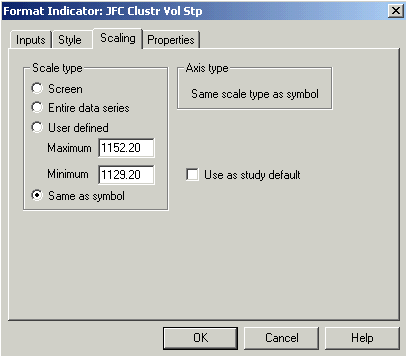
The
scaling tab for this indicator must be set to Same as price data for an
effective plot to appear on your trading screen.
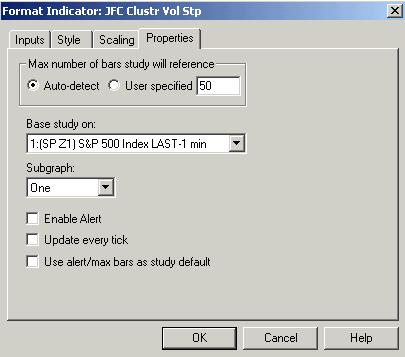
Properties
This indicator must be placed in Subgraph One, as indicated on the next page. There are no alerts programmed into this indicator.
It is not usually necessary to update this study with every tick. Since the Cluster portion of this program is quite processor intensive, doing so could significantly reduce your computer’s performance.
The
following chart is an example of the JFC Cluster Volatility Stop Indicator as
applied to a two-minute chart of E Bay.
Note
that the trailing stop portion of the indicator begins plotting with the large
dots and terminates its activity when the price bars intercept the trailing stop
plots.
The
proper use of this tools means that the trader would place the exit stop at the
level indicated by the indicator’s trailing stop.

Close
observation of the plots of this indicator and those from the JFC Volatility
Stop Indicator will reveal that the trailing portion of the JFC Cluster
Volatility Stop does not “back
away” from the market in response to increasing volatility as does the
trailing plot generated by the JFC Volatility Stop Indicator.
This
is an intentional feature and not a programming error. Since the JFC Cluster
Indicator is more often used in this format on the higher risk markets, we feel
a more aggressive trailing stop routine is more appropriate in these situations.
The
next chart is a 5-minute chart of Nextel Communications. It is illustrative of
the use of the JFC Cluster Volatility Stop Indicator over a relatively longer
term perspective spanning several days.
Note
that the major trade on this chart, just before the 12:45 time stamp of 3/08,
was effectively maintained using the trailing stop as defined by our indicator.
The position in this instance was maintained for the major portion of a three
day period using a relatively short 5 minute time frame.

We
encourage you to review the differences between the JFC Cluster Volatility Stop
Indicator and the JFC Volatility Stop Indicator. Careful observation of the
design differences of the two similar indicators will help you in determining
which tool is best suited to your preferred market(s) and trading style.
