|
1
|
- Presented by Dr. John F. Clayburg
- www.clayburg.com
|
|
2
|
- Each speaker at the TradeStationWorld Conference acts independently,
and no speaking topic, session, seminar or content is affiliated with,
or approved, sponsored or endorsed by, TradeStation Technologies, Inc.
or any of its affiliates. Topics, sessions and seminars are solely for
educational purposes. The speaker roster and session/seminar content are
subject to change without notice.
No investment or trading advice regarding any security, group of
securities, market segment or market is intended or shall be given. Any
examples used in sessions, seminars or speaking topics are for
illustrative purposes only -- they should never be construed as
recommendations or endorsements of any kind. No particular trading strategy,
technique, method or approach discussed will guarantee profits,
increased profits or the minimization of losses. Past performance, whether actual or
indicated by simulated historical tests, is no guarantee of future
performance or success.
Testimonials may not be
representative of the experiences of other customers and are not
indicative of future performance or success.
- TradeStation
Technologies, Inc., the host of the conference, and TradeStation
Securities, Inc. (Member NASD, SIPC and NFA), the conference's premier
sponsor, are affiliated companies. "TradeStation," as used in
this presentation, refers to the trading analysis software products,
platforms and services that have been developed by TradeStation
Technologies.
|
|
3
|
- This presentation will explain
in detail several, specific, practical approaches to system design that
will assist traders by designing systems that can keep pace with current
market conditions.
|
|
4
|
- 1. Visual approach.
- 2. Semi automated approach using parallel function based indicators.
- 3. Totally automated approach.
|
|
5
|
- Before we proceed….
- Consider that when creating automated trading systems we are effectively
attempting to mathematically predict human behavior.
|
|
6
|
- Remember that technical analysis
is not a world of absolute certainty….
- But a world of probabilities and possibilities
|
|
7
|
- Background
- Automated trading systems use
certain values that define critical system calculations and therefore
control system performance.
- These values are fixed within
the system structure and do not change unless alterations are done
manually.
|
|
8
|
- Unfortunately, the best values
for these inputs can vary considerably as markets change and evolve over
time.
- Optimal results are not
produced by the system since the key values for the system remain fixed.
|
|
9
|
- For example, a system using a
simple moving average crossover may give the best profit picture in the
March contract of the e mini s&p using values of 9 and 18 for the
two moving average settings.
|
|
10
|
- However, when the same system
is applied to the June contract radically different settings may be
required to return the desired results.
- Unfortunately, the system does
not return the best results since it is still using the 9 and 18 values
for the system inputs.
|
|
11
|
- What changes in the markets are
responsible for the varying responses of trading systems?
- Volatility?
- Emotion?
- Greenspeak?
- Politics?
|
|
12
|
- Who cares.
- All fundamentals are eventually
factored into price anyway.
- The pure market technician only
analyzes price action to generate trading signals.
|
|
13
|
- In the same fashion, the parallel
function / self-adaptive approach to system design ignores the actual
market fundamentals that cause the system to respond differently during
different time frames.
|
|
14
|
- The results of these changes in
market personality will be reflected in the actual system results.
- Use the system itself as a diagnostic routine.
|
|
15
|
- Effectively, we are using a version of the system itself to tell us what
the best system settings are for the current market conditions.
|
|
16
|
- While the purpose of this presentation is to discuss the creation of
automated self adaptive systems, there are other, simpler methods to
keep a system in sync with the market.
|
|
17
|
- Several methods:
- Visually monitor multiple settings
- Re-optimize the system
- Automate the system to a greater degree
|
|
18
|
|
|
19
|
- 2. Re-optimize the system
- When trading results begin to deteriorate
- On a regular schedule.
- Danger of curve fitting the system to historical data.
|
|
20
|
- Another method used to keep a system trading profitably through changes
in market personality.
- Self – Adaptive Parallel Function Automation
|
|
21
|
- In the same manner that market
technicians focus only on price action to make their predictions, the
self – adaptive parallel function approach to system design focuses only
on the response of the system to varying market conditions.
|
|
22
|
- Self – adaptive systems change
their critical trading parameters
“ on the fly “ to assure the use of the most productive system settings
for the current market.
|
|
23
|
- This unique approach to
automated system design effectively uses the system itself as an tool to
decide which system settings are appropriate for the current market.
|
|
24
|
- What is a “Parallel
Function”?
- A Function programmed as a system.
- Allows the user to monitor system performance over a range of input
variables.
- Can be used visually when plotted as an indicator
- Can be used in actual system code to reset system variables as current
market conditions indicate
|
|
25
|
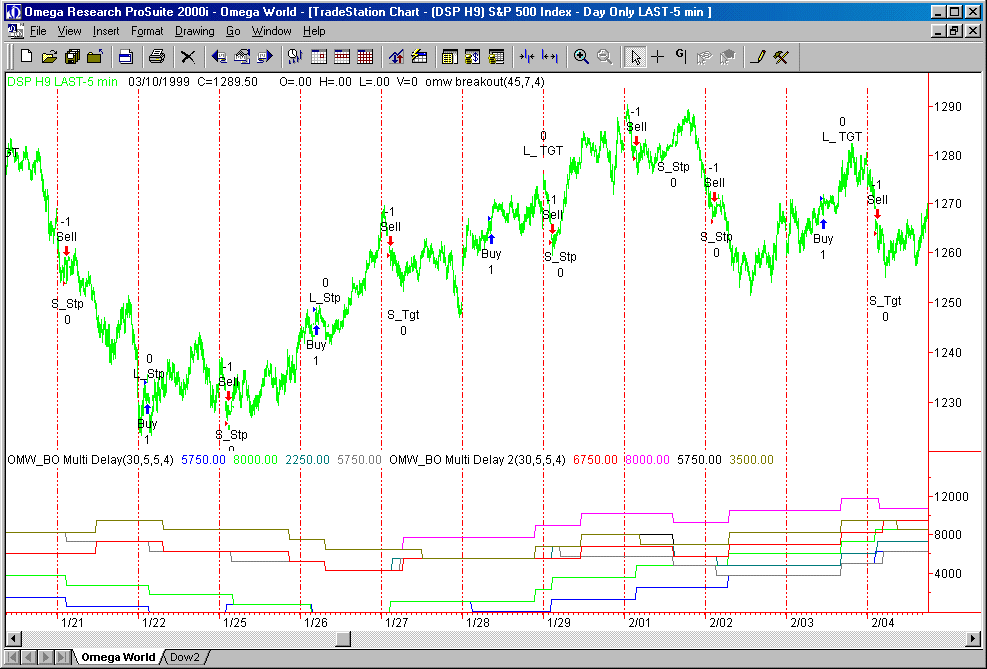
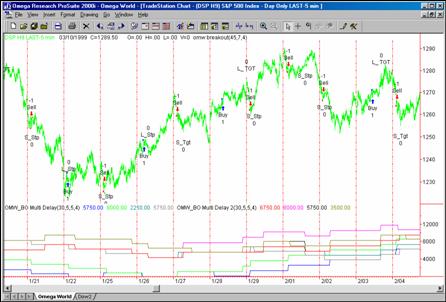
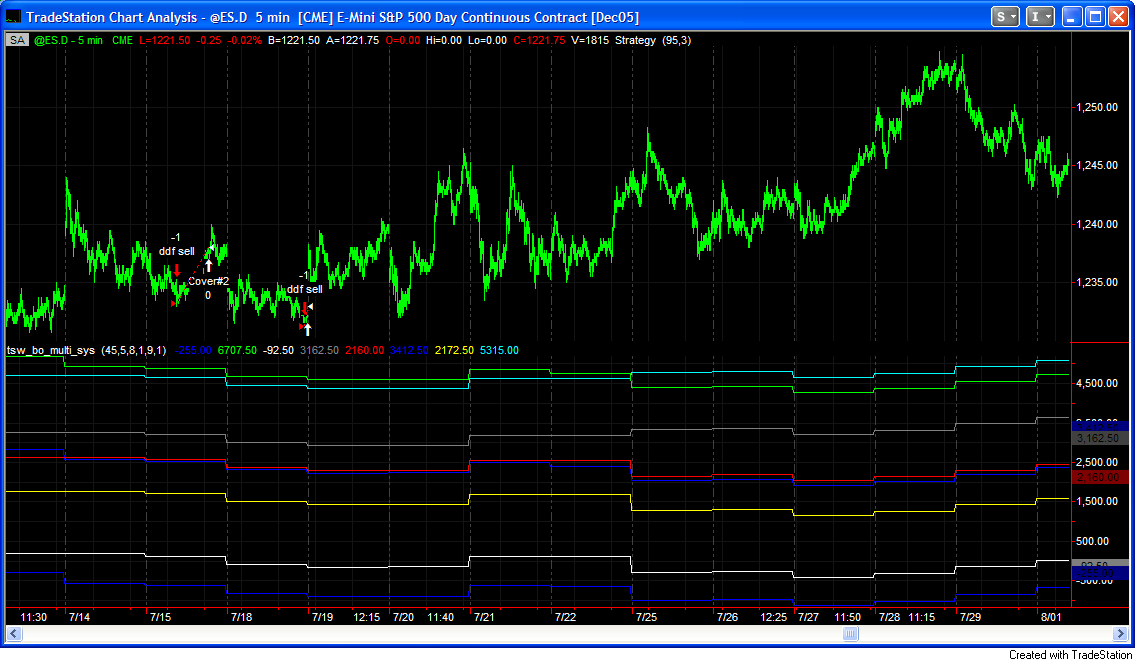
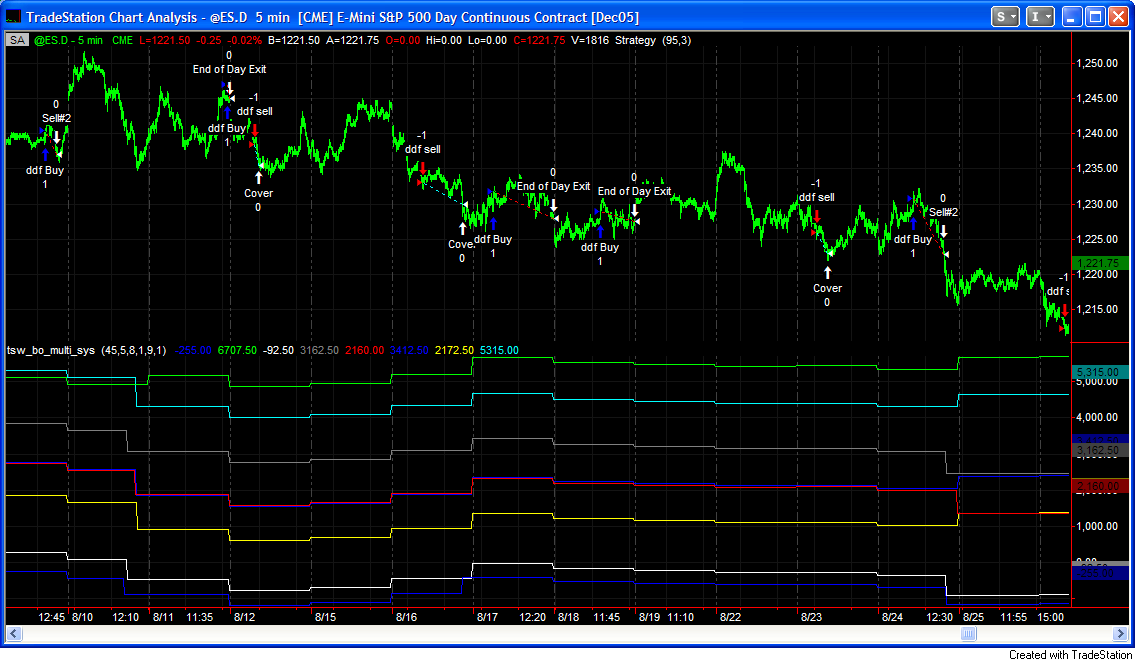
- Using a Parallel Function as an
Indicator
Indicators will graphically interpret when a significant change
has occurred in the manner in which the system is responding to changes
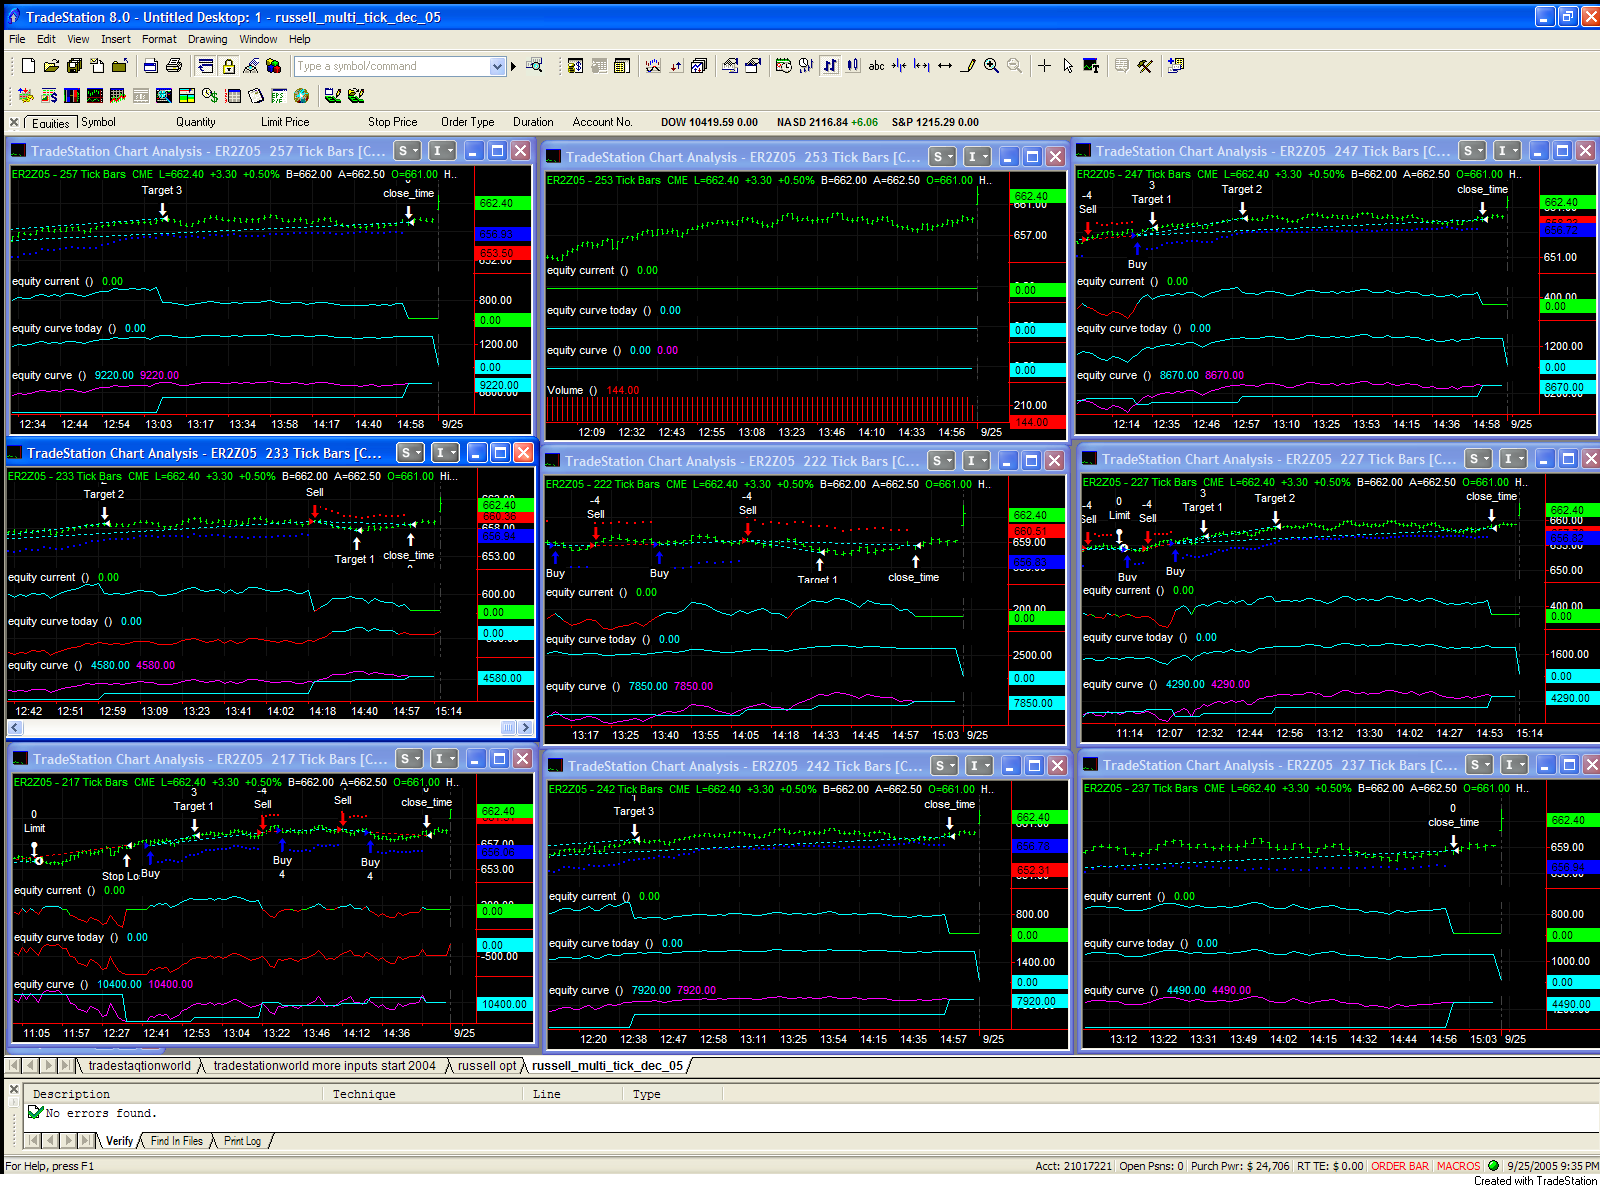
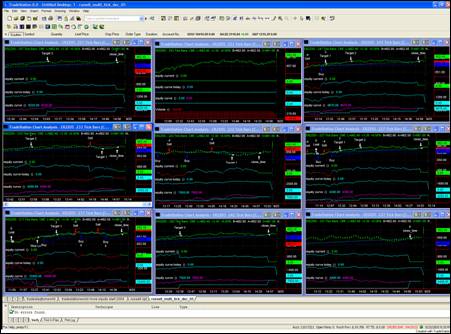
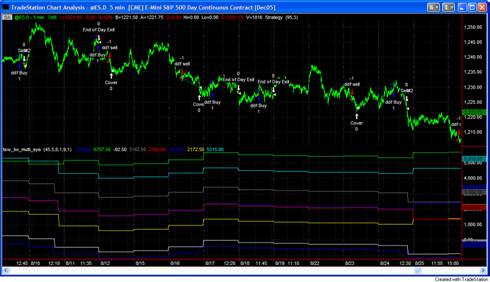
in market personality.- The user has the ability to create any number of simulated systems which
will plot as an indicator.
- It is possible to observe which system settings are the most profitable
at any point in the chart.
|
|
26
|
- Using a Parallel Function as an
Indicator
|
|
27
|
- Using a Parallel Function as an
Indicator
|
|
28
|
- Using a Parallel Function as an
Indicator
|
|
29
|
- Using a Parallel Function as an
Indicator
|
|
30
|
- Using a Parallel Function in an
Automated Trading System
|
|
31
|
|
|
32
|
- How does it work?
- Run multiple systems in the background, in real time.
- Set up a routine to track performances of all background systems.
- Report to the main system which settings are currently creating the
preferred trading results.
|
|
33
|
- Then simply allow the base system actually generating trading signals to
use these inputs.
- That’s it.
|
|
34
|
- System – Parallel Function Schematic
|
|
35
|
- Simple, huh?
- Well…..
- Not quite…….
|
|
36
|
- Knowing which dots to place on the wall and knowing what each dot means
is one thing.
|
|
37
|
- ??
- Connecting them to make it all
work can be quite another task.
- The programming required to
create systems of this nature is a bit more complicated.
|
|
38
|
- Step 1
- Create the parallel function.
- This is the most critical step
as the function must exactly parallel system activity.
|
|
39
|
- The parallel function must be written to deliver identical buy, sell and
exit points as the base system.
- Buy, Sell, Buy to Cover, etc. statements may not be used in functions.
|
|
40
|
- Step 2
- In the parallel function, set
up routines to test all combinations of system variables passed to the
function by the base system.
|
|
41
|
- Step 3
- Still in the parallel function,
set up sort routines to capture optimal system variable values.
|
|
42
|
- Step 4
- In the base system, set up a
routine to capture the optimal values from the parallel function and
utilize these values to generate the next trading signals.
|
|
43
|
- Day trading systems respond
best to automated re-testing each 2 – 3 weeks.
- “Swing” or shorter term overnight systems should be auto - retested
less frequently depending on the frequency of trading generated by the
system.
|
|
44
|
- As a general rule, at least 20
trades or two months time should pass between each automated system
variable reset.
|
|
45
|
- Anyone who has designed or
traded systems will readily recognize that over optimization or using an
overly restrictive testing routine often results in a significant
decrease in system performance.
|
|
46
|
- One of the advantages
realized by parallel function system testing is that the testing routine
itself can be back tested.
|
|
47
|
- In this manner one is able to
observe what the results of the system would have been had
re-optimization occurred at regular, defined intervals over specified
input values.
|
|
48
|
- Additional Considerations
- This is not a “canned”
function that can be applied to any system by simply adding a function
or separate strategy.
- It is necessary to create a
specific parallel function or functions for each system to which this
routine is to be applied.
|
|
49
|
- Additional Considerations
- This routine is not a
cure-all for a bad system. In fact, it will probably make it worse.
- Parallel function self
testing is the most effective on a sound, robust system that is showing
consistent results.
|
|
50
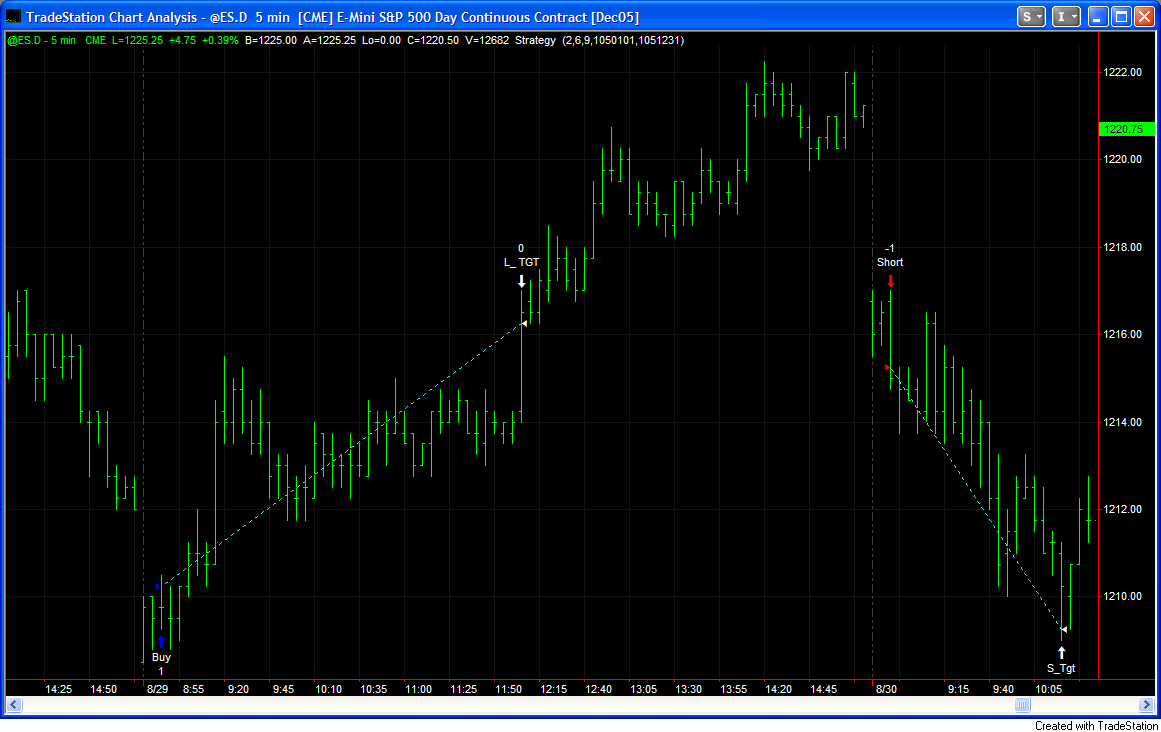
|
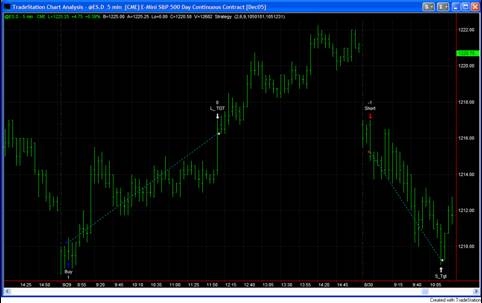
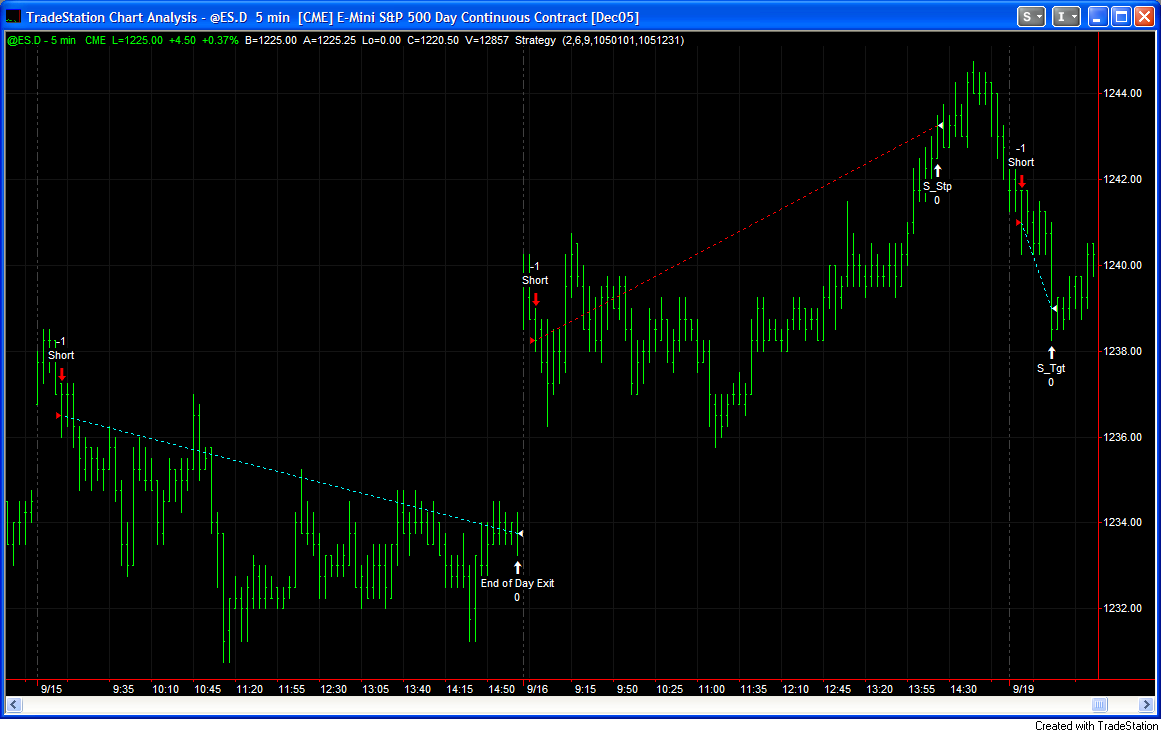
- Demo System Rules:
- 1. Buy or sell the early range breakout.
- 2. Take profits at a set target.
- 3. Use a set protective stop.
- 4. Exit end of day if no target or not stopped out.
|
|
51
|
|
|
52
|
|
|
53
|
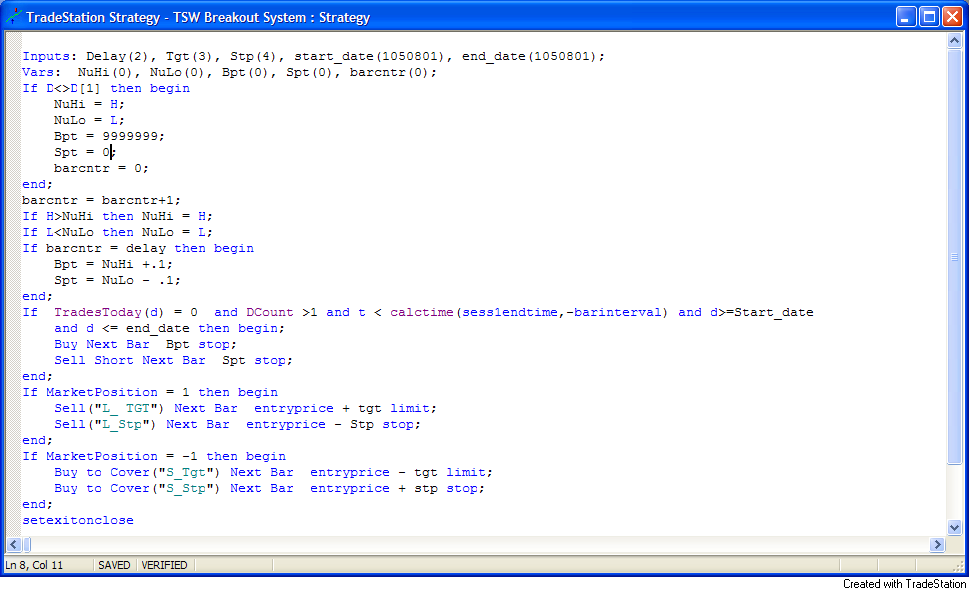
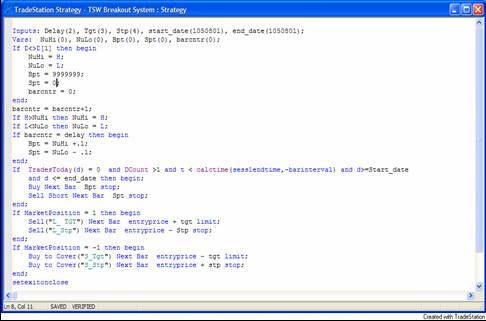
- Demo System
- Here’s the EasyLanguage Code for the demo system.
|
|
54
|
|
|
55
|
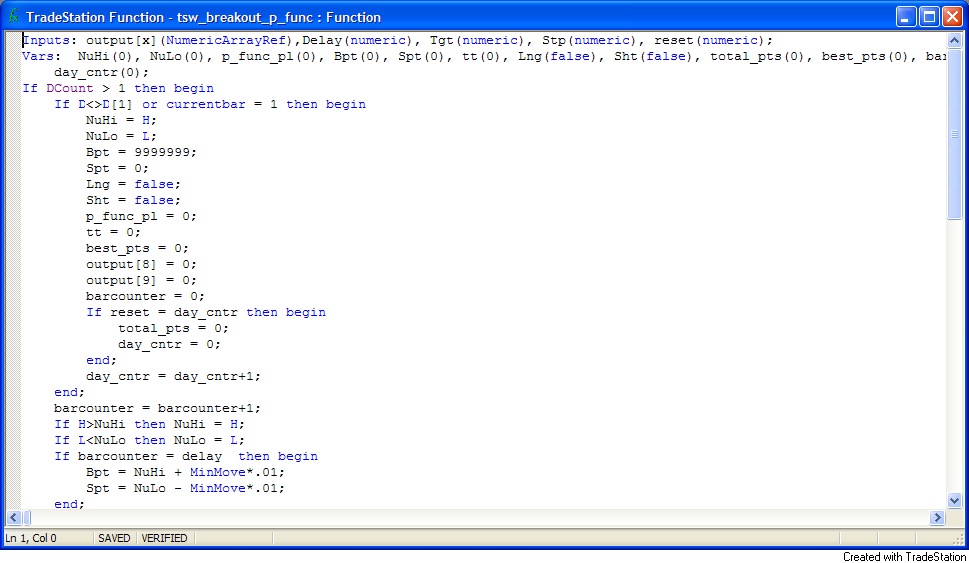
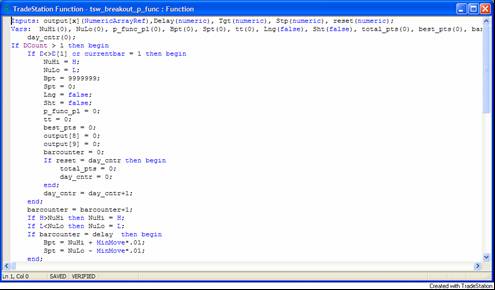
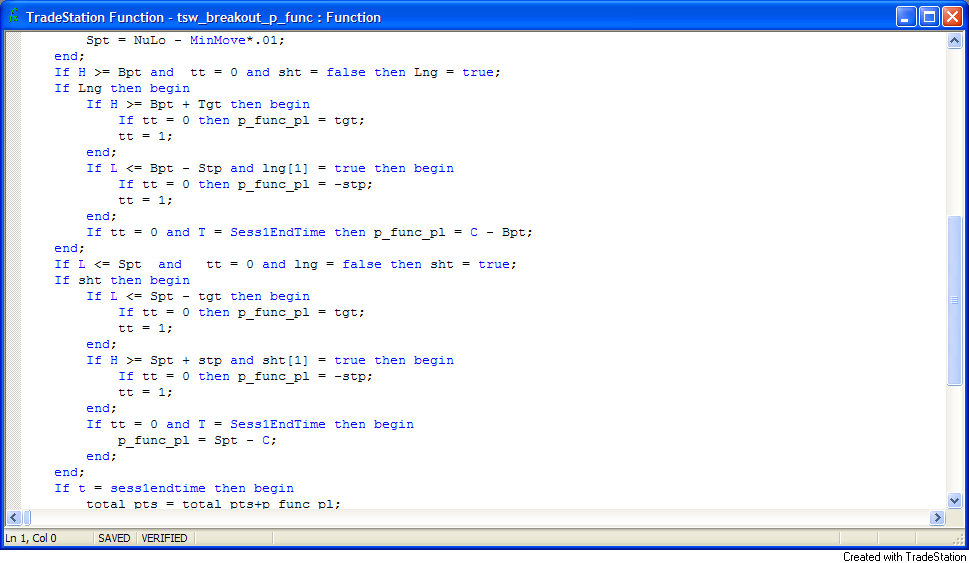
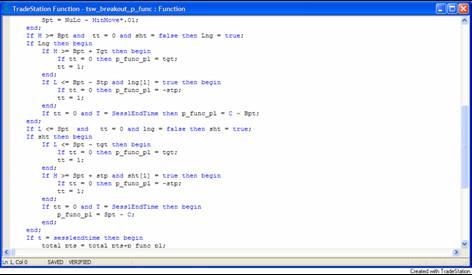
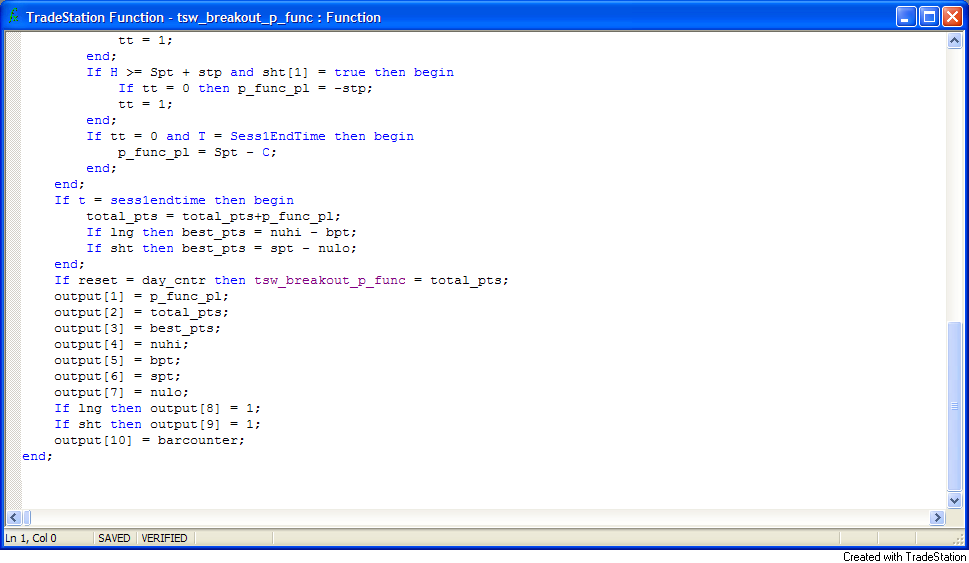
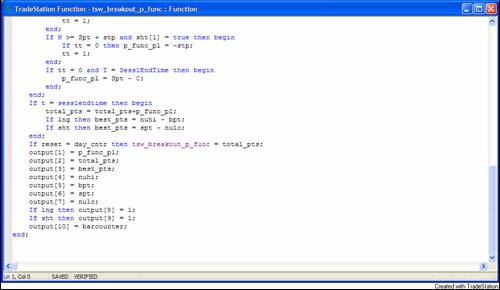
- Demo System
- Here’s the EasyLanguage Code for the parallel function that mirrors the
base system and is used to regularly check for the best system settings
|
|
56
|
|
|
57
|
|
|
58
|
|
|
59
|
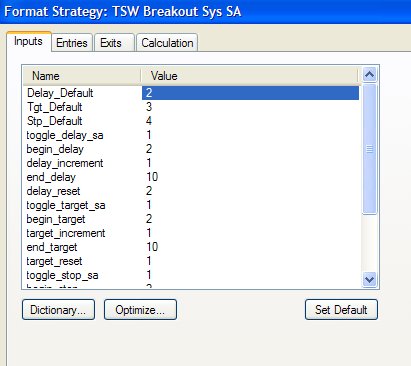
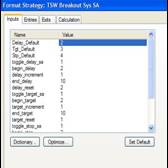
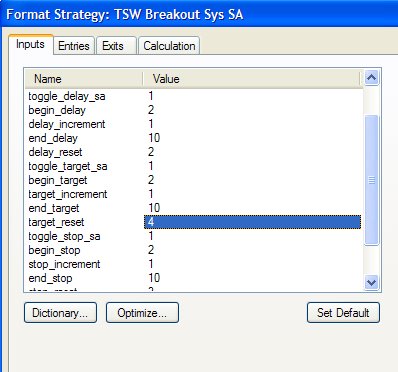
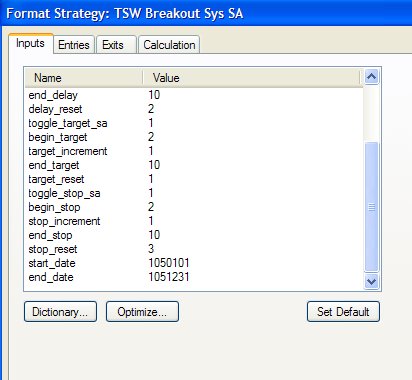
- Automated, Self Adaptive early range breakout system.
- Additional Inputs
|
|
60
|
|
|
61
|
|
|
62
|
|
|
63
|
|
|
64
|
|
|
65
|
|
|
66
|
|
|
67
|
- Now lets look at the actual system on the
e-mini S&P 500 contract
- For the purposes of this demonstration I have optimized the base system
for each parameter beginning 1-2-2005.
- We will compare the results of optimization over the last year to the
results of regular re-setting using the parallel function.
|
|
68
|
|
|
69
|
- Frequently Asked Questions:
- Is this a neural network?
- No.
- Although the parallel
function approach does use previous experiences to make real time
decisions, the process used by a neural network is significantly
different.
|
|
70
|
- Frequently Asked Questions:
- How does this approach differ
from frequent system re-optimization that can result in curve – fitting
the system to historical data?
|
|
71
|
- While frequent optimization
can certainly result in a curve fitted system, the regular, structured
and limited testing done by parallel functions will not over optimize if structured properly.
|
|
72
|
- How can you, as a trader,
make use of this technique?
- 1. This system is provided free. Trade it or better yet, use it to learn
to program your own self adaptive system.
|
|
73
|
- 2. Self adaptive indicator
packages and systems. www.clayburg.com
- Two day intensive seminars
- Oct 16 – 17 in Denver
|
|
74
|
- Managed FOREX Account
- Real Time Results Available
|
|
75
|
- Thank you for your interest.
- Dr. John F. Clayburg
- www.clayburg.com
- clayburg@pionet.net
- 712.684.5239
- 712.830.5062 cell
- Booth # 10
|
 Notes
Notes