|
|
|
|
|
|
|
|
JFC
Exhaustion 2 Indicator
The JFC Exhaustion 2 Indicator is a companion indicator to
the JFC Exhaustion Indicator.
Inputs
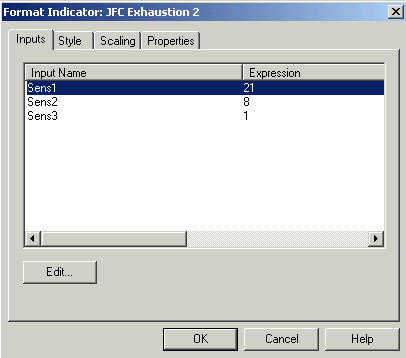
The input screen appearing above is exactly the same as
the input page for the JFC Exhaustion Indicator.
It is extremely important
that the inputs being used for JFC
Exhaustion2 be identical to those being used
for JFC
Exhaustion. Failure to match these values exactly will result in a
charting picture which will be difficult, if not altogether impossible, to
interpret.
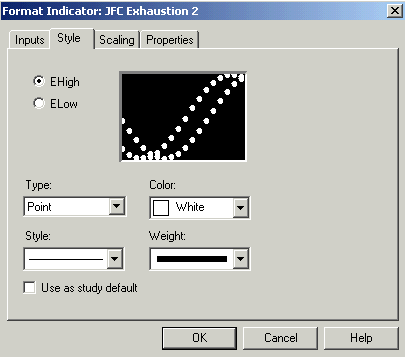
Style
The Style screen on the following page, shows the two
plots for the indicator. “E High” and “E Low” are both defaulted to a
white plot and a medium weight.
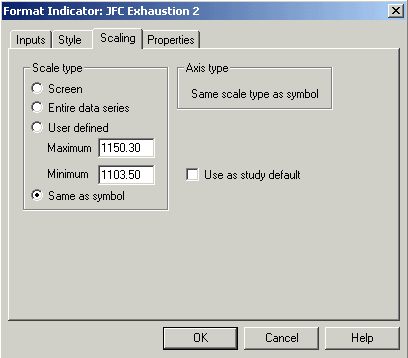
The scaling
setting for the JFC Exhaustion 2 Indicator is shown above.
It is critical
that this setting remain on “Same as price data”. Other settings will render
a totally useless picture on your chart.
Properties
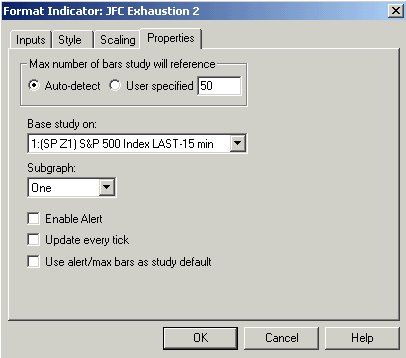
There is an
alert programmed into the JFC Exhaustion 2 Indicator. It is designed to notify
the user each time that a dot is placed on the chart by the program.
If this indicator is to be used in conjunction with
JFC Exhaustion it should obviously be placed in the same subgraph, as indicated
above. Some users opt to place the JFC Exhaustion Indicator in Subgraph 2 to
allow better visibility on the price bars while retaining the ability to observe
the 4 lines of the indicator as they interact with each other throughout the
trading day.
These same users then will plot the JFC Exhaustion 2 Indicator on the price bars, allowing the white dots to confirm exhaustion directly on the price bars. This is certainly an acceptable method by which to display this indicator combination and will not in any way interfere with the accurate interpretation of these tools.
Do not
enable the “Update every tick” option in the Properties box above in an
attempt to get an earlier signal. Doing so will only risk the generating of
multiple false signals from this indicator combination.
Objective
The
JFC Exhaustion 2 Indicator has the sole objective of enhancing the interpretation of
its companion indicator, JFC Exhaustion.
Recall from our previous discussion that a valid signal
from the JFC Exhaustion Indicator occurs when the red line leaves the envelope
formed by the yellow bands and then either turns up or down on a closing basis.
The
JFC Exhaustion 2 Indicator superimposes a white dot on the red line when the line
has turned on a closing basis. This is strictly a visual aid for the trader so
that he / she does not have to spend time concentrating on the direction of the
red line and to whether or not the bar in question has closed. With this aid,
the appearance of the white dot is confirmation that the signal as generated by
the JFC Exhaustion Indicator is now valid.
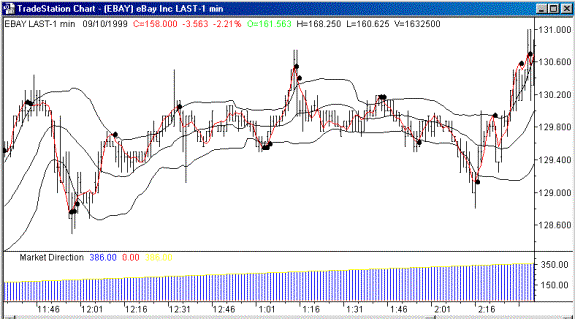
On the E Bay chart on the
following page, we have added the Exhaustion 2 plot as a black dot so as to be
able to illustrate this indicator on this black and white chart. Recall that the
indicator, as defaulted, will place a white dot on your trading screen at the
appropriate point.
The
black dots which appear above the price bars and above the bands which make up
the JFC Exhaustion Indicator are pointing out sell signals. The dots below the
bars and Exhaustion bands are signifying buying signals.
Recall that we strongly
recommend using this indicator in combination with JFC Cluster, JFC Reversal and
JFC Real Time Pivot to identify the termination of corrective moves in the
market.
We
then advocate the use of the JFC Entry Point Indicator to give the trader a
definitive entry value for the trade.
Although
one may enter the market strictly on the basis of the JFC Exhaustion 2 Indicator
alone, it is not recommended that you do so without confirmation from your other
trading tools.
Some may
inquire as to why these plots are not all incorporated into a single indicator
rather than requiring two indicators be plotted with the same inputs.
The answer
is a simple one - the current Omega products will only allow four plots per
program. Since there are 5 plots required for this combination, it was necessary
to program a second indicator for the 5th plot.
